Welcome back to my series on Gawler election history! While 2018 is still relatively recent as elections go, this one has some differences from 2022 that I think are worth investigating. Compared to its surrounding election years, 2018 had a small field of candidates, no Mayoral contest, and an unusually low voter turnout, at only 28.7%.
How does that lead to an even longer post than last time, you might ask? Stick around to find out!
The Mayoral Election
In my post on the 2022 election, I had a long section breaking down the results of the mayoral election. I won’t be doing that here, mostly because this is as straightforward as elections get.
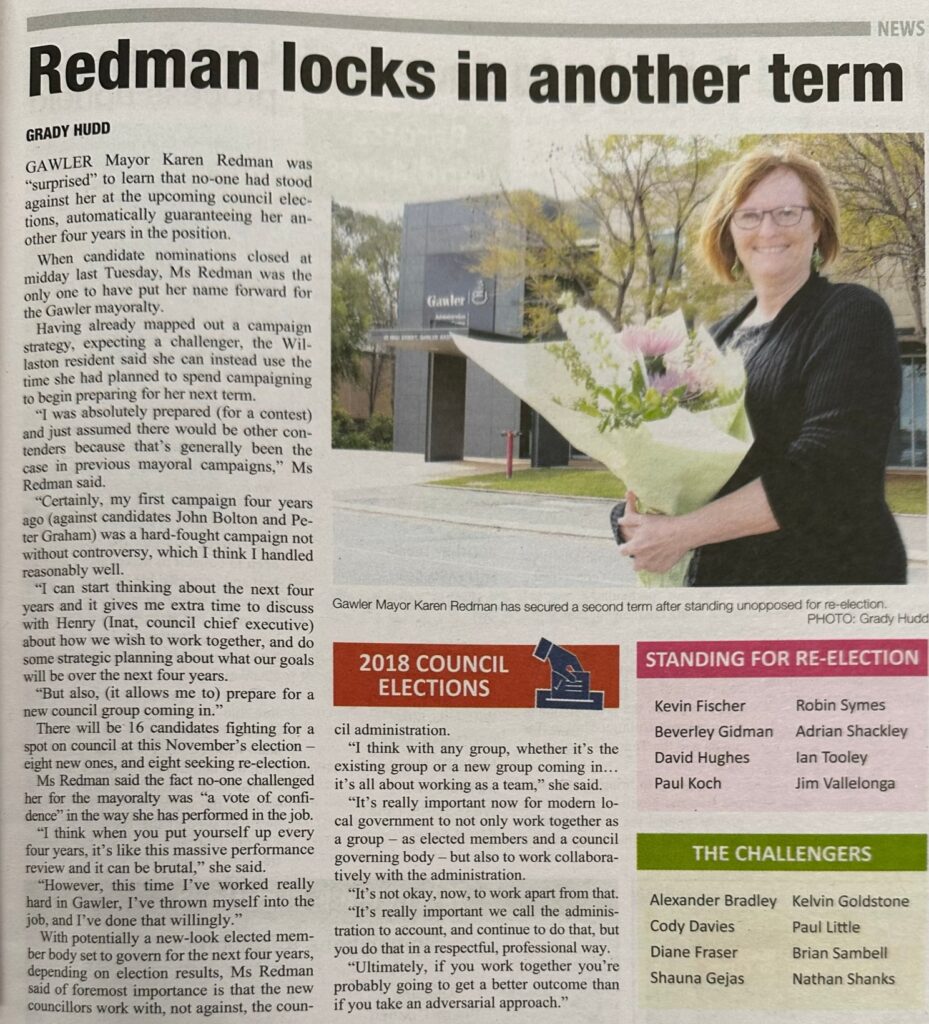
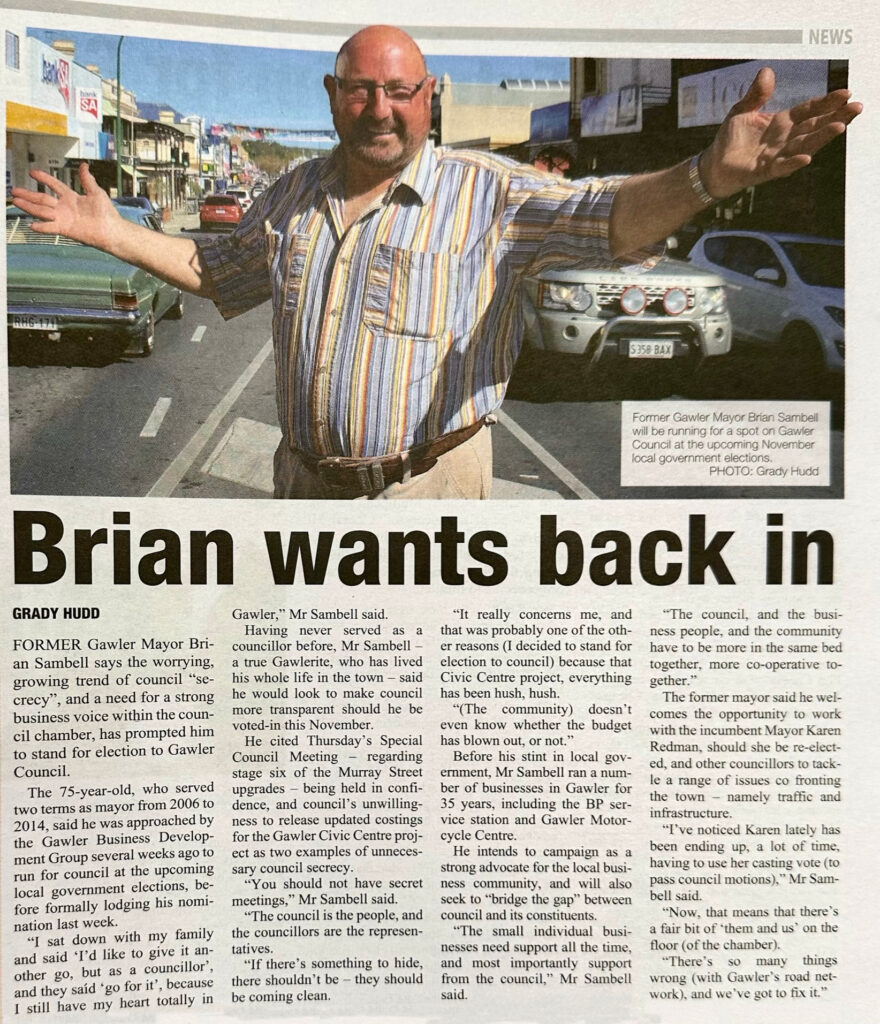
The Bunyip, September 26th, 2018.
The nomination period passed, and only the incumbent Mayor, Karen Redman, put her hand up for the job, so she was re-elected by default as soon as nominations closed.
An extremely efficient process, I have to say, though maybe not the healthiest one for keeping local residents engaged in our electoral process (overall voter turnout goes down when there’s no Mayoral election). It’s a more common situation than you’d think, however, especially when we get back into the 20th century.
The Councillor Election
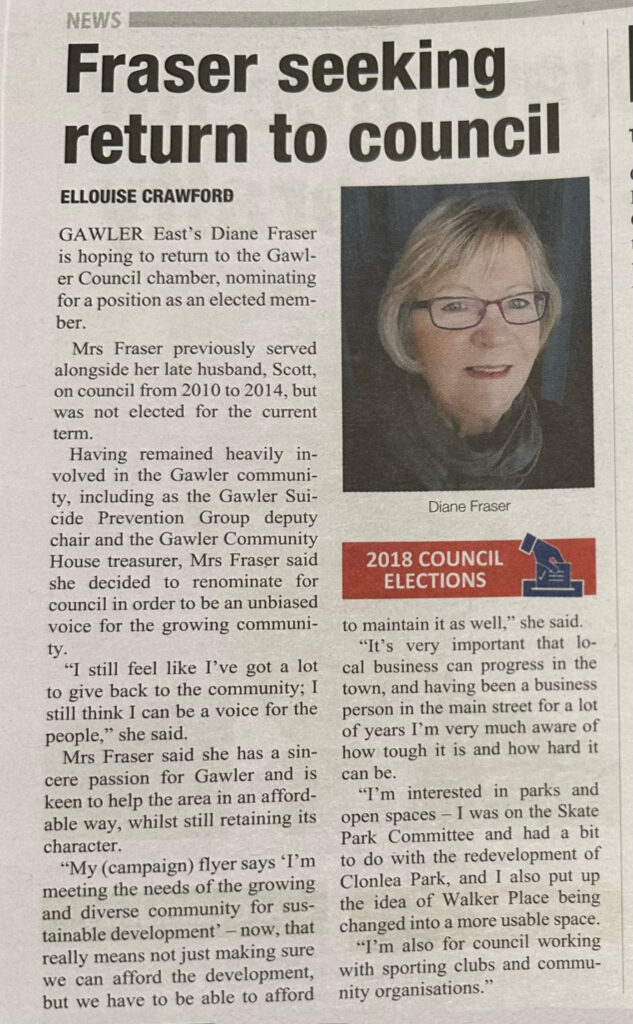
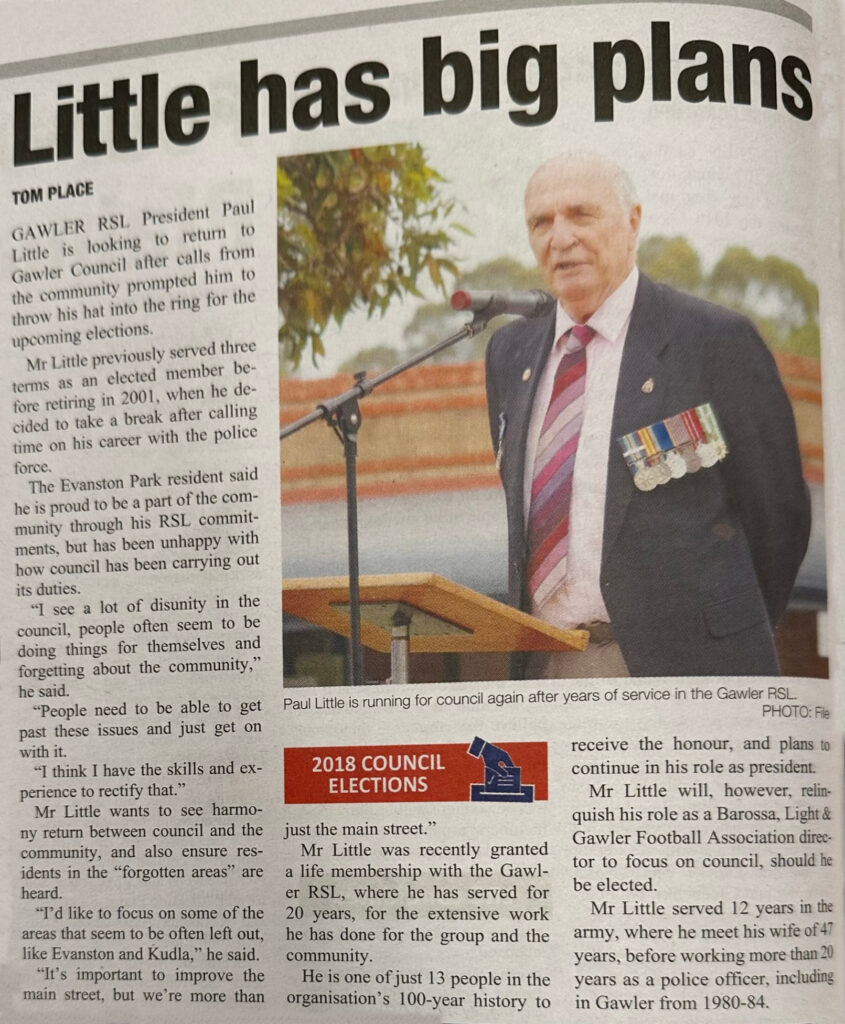
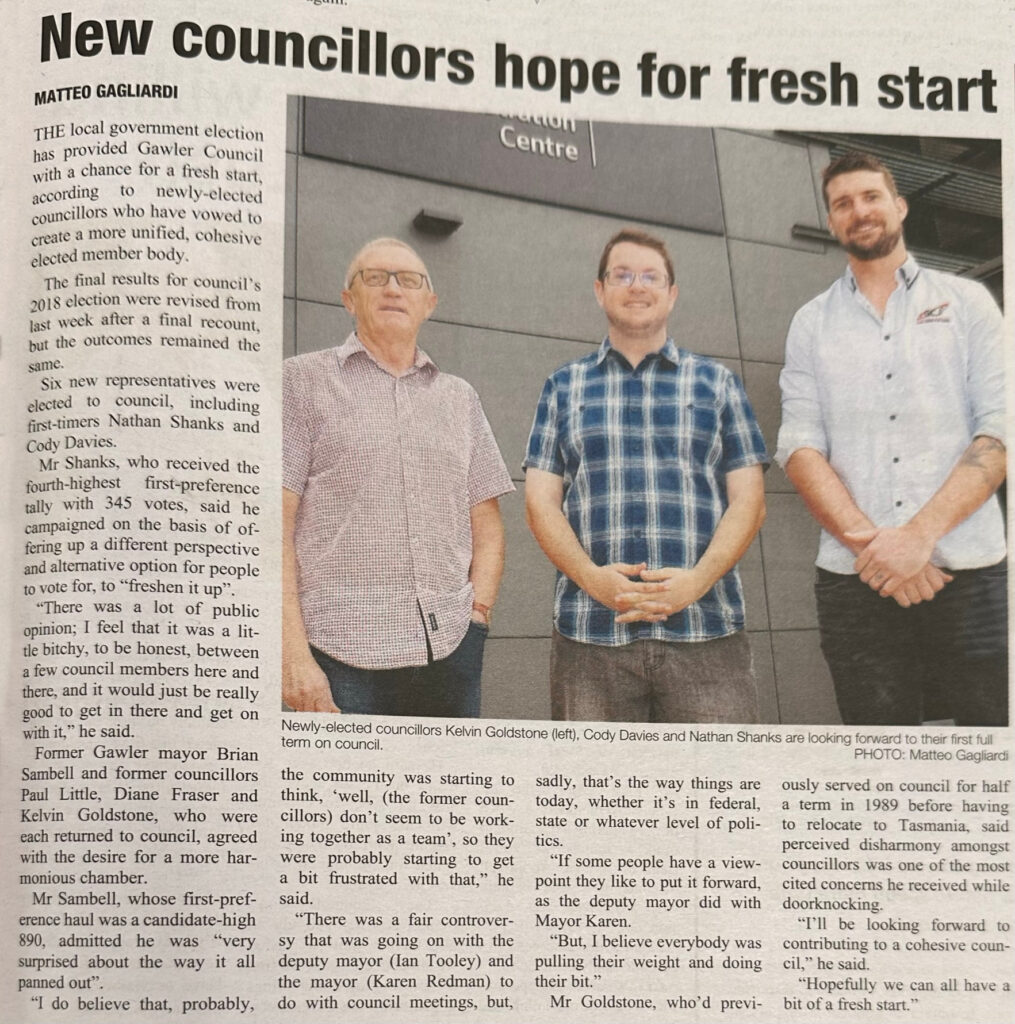
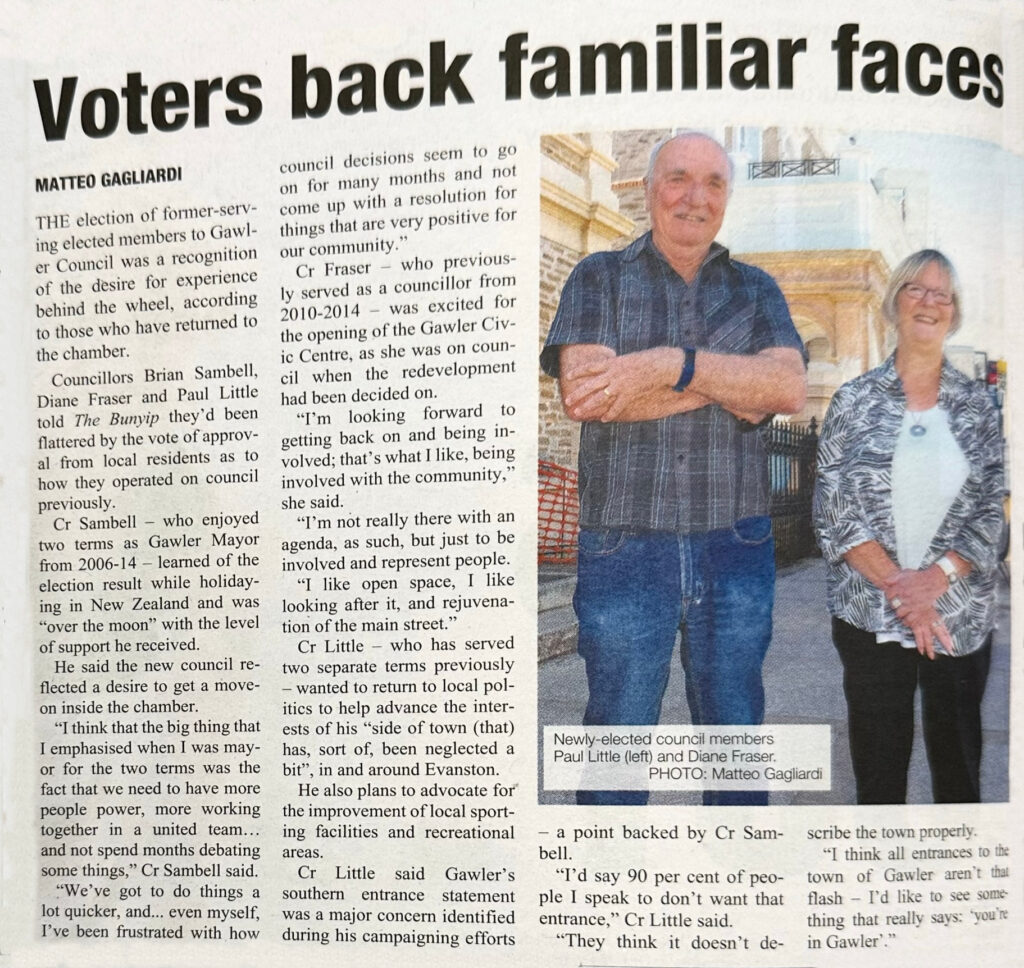
In the greater scheme of Gawler Council elections, sixteen candidates is a low turnout for ten positions – 2022 had twenty-three candidates, whereas 2014 (which we’re getting to next) had a record twenty-five. Of the fifteen candidates who failed to get in that year, only three ran again in 2018 – Kelvin Goldstone, Diane Fraser and myself. Incidentally, all three of us were successful in that re-attempt. As they say: if at first you don’t succeed, try, try again.
The Bunyip article I shared above notes the sixteen nominees as being split into eight incumbent Councillors and eight challengers; this is true, though it’s worth noting that the actual number of candidates without Council experience was only four: Nathan Shanks, Alex Bradley, Shauna Gejas, and myself. The remaining four “new” candidates had been on Council previously, just not as part of the outgoing 2014-2018 Gawler Council.
As for why two of the last chamber’s Councillors didn’t run again this time, Cr Merilyn Nicolson chose to retire from Council, whereas Cr Scott Fraser (husband of candidate Diane Fraser) unfortunately died from cancer a year after the 2014 Council election, leaving the chamber with only nine Councillors throughout most of its term.
So why was there no by-election to replace him? The short explanation is that the legislative trigger for Gawler Council to hold a supplementary election is when there is more than one vacancy. Councils generally don’t like holding by-elections when they don’t have to, because they take a lot to organise and are, more importantly, expensive.
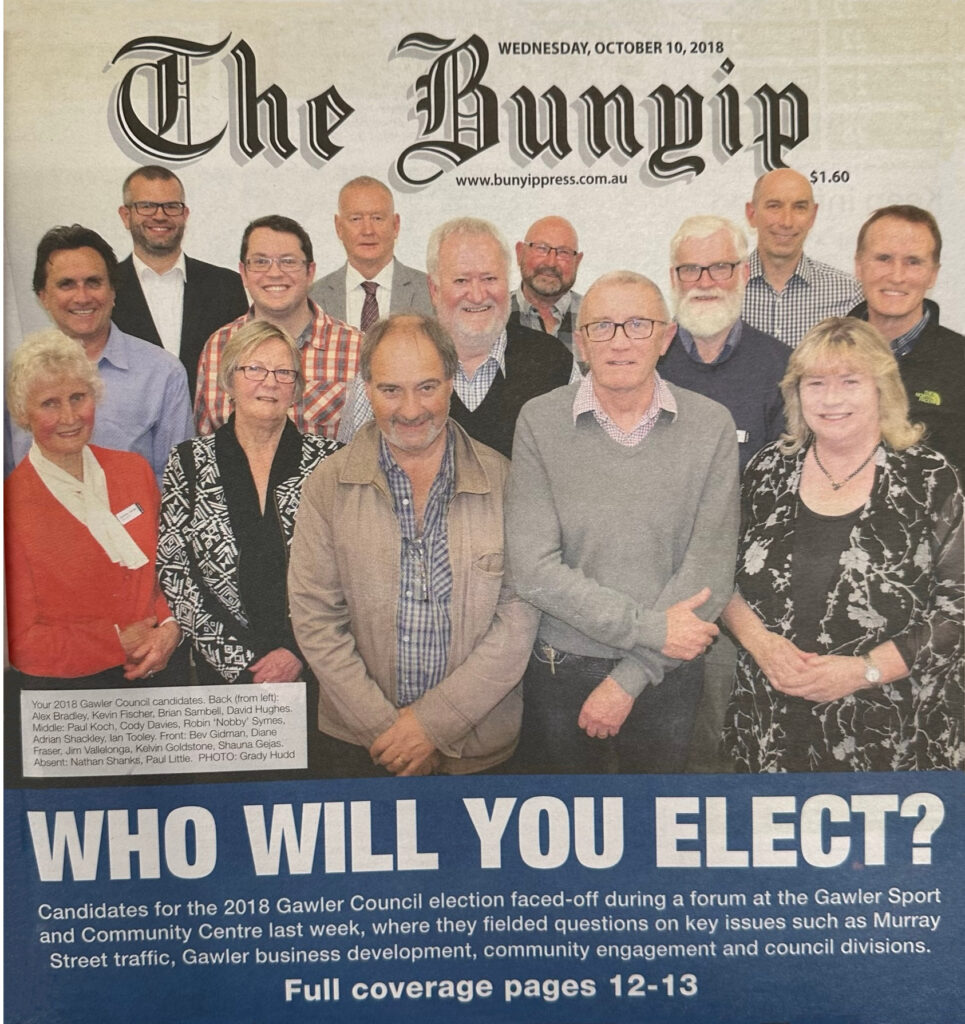
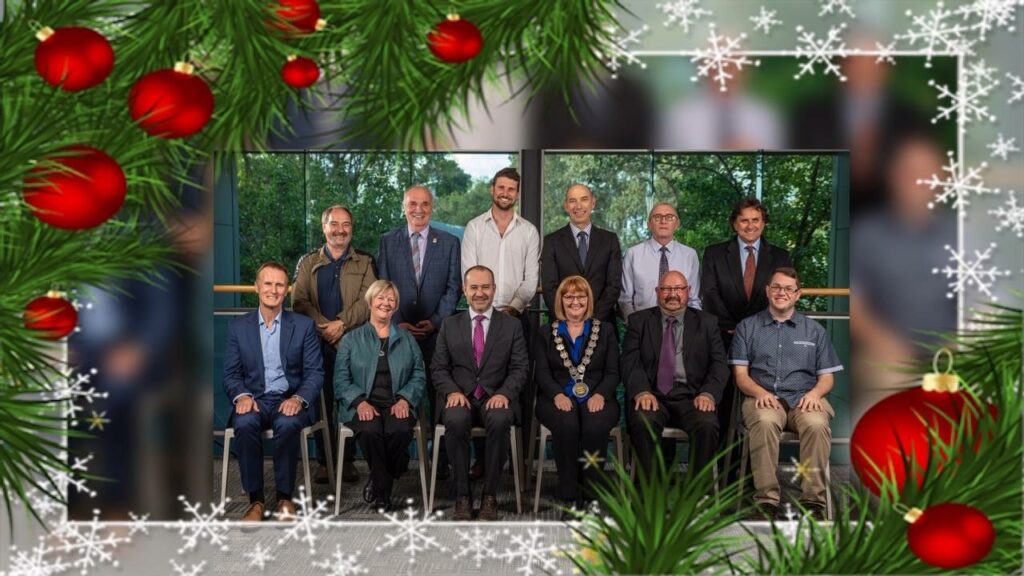
I’m not sure as to why it was such a quiet year for nominations, with very few fresh faces putting their hand up for Council and nobody challenging for the Mayoral position, but to address an elephant in the room here – look, you wouldn’t be the first person to note the demographic trends in the above group photo of the candidates (that is to say, a preponderance of men). In 2018, 13 men and 3 women nominated for a Councillor position.
It’s certainly worth noting that our past three Councillor elections have resulted in male-female splits of 9-1, 9-1, and 8-2 respectively (made to look slightly better if we add in our Mayor). This isn’t just typical fare for South Australian Local Government either – nearby Councils like Salisbury and neighbouring Playford both have majority-female Councils at the moment as just a matter of course. It’s something to think about when the next election cycle rolls around in 2026.
Once a Council election reaches the voting stage then the decision of who to elect is obviously up to the voters, but I suspect where there may be a roadblock is in people feeling confident about nominating in the first place. If you are interested in running for Council in the future but are unsure where to get started, feel free to contact me and I can hopefully point you in the right direction (the earlier you start planning, the better). One thing I’d like to do with this site in future is to create a series of public posts for that kind of advice, but one project at a time!
So, let’s get to these results.
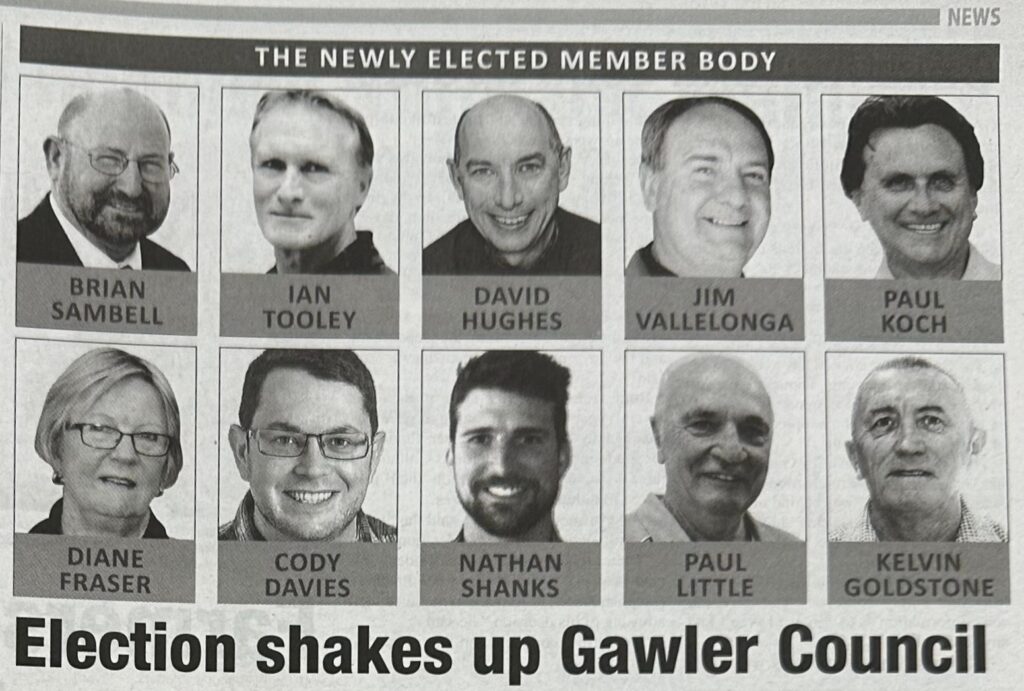
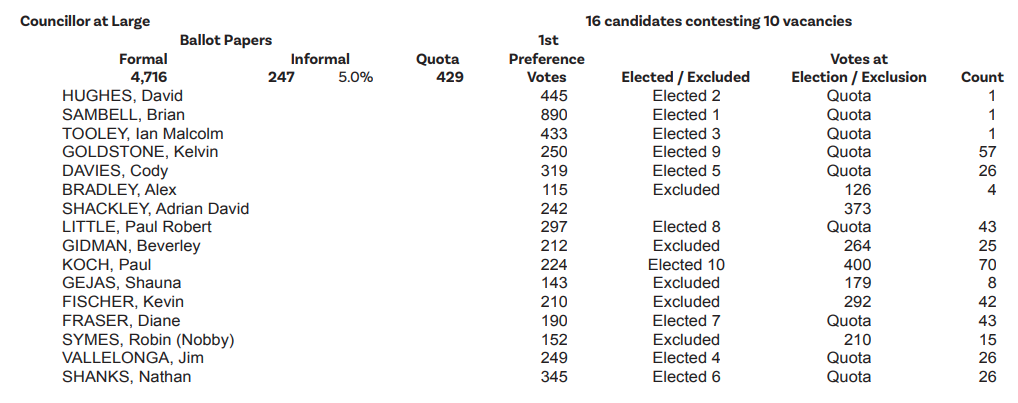
In order of their election, the Councillors for the 2018-2022 term were:
- Brian Sambell (returning but not incumbent)
- David Hughes (incumbent)
- Ian Tooley (incumbent)
- Jim Vallelonga (incumbent)
- Cody Davies (new) (that’s me)
- Nathan Shanks (new)
- Diane Fraser (returning but not incumbent)
- Paul Little (returning but not incumbent)
- Kelvin Goldstone (returning but not incumbent)
- Paul Koch (incumbent)
The candidates that missed out were:
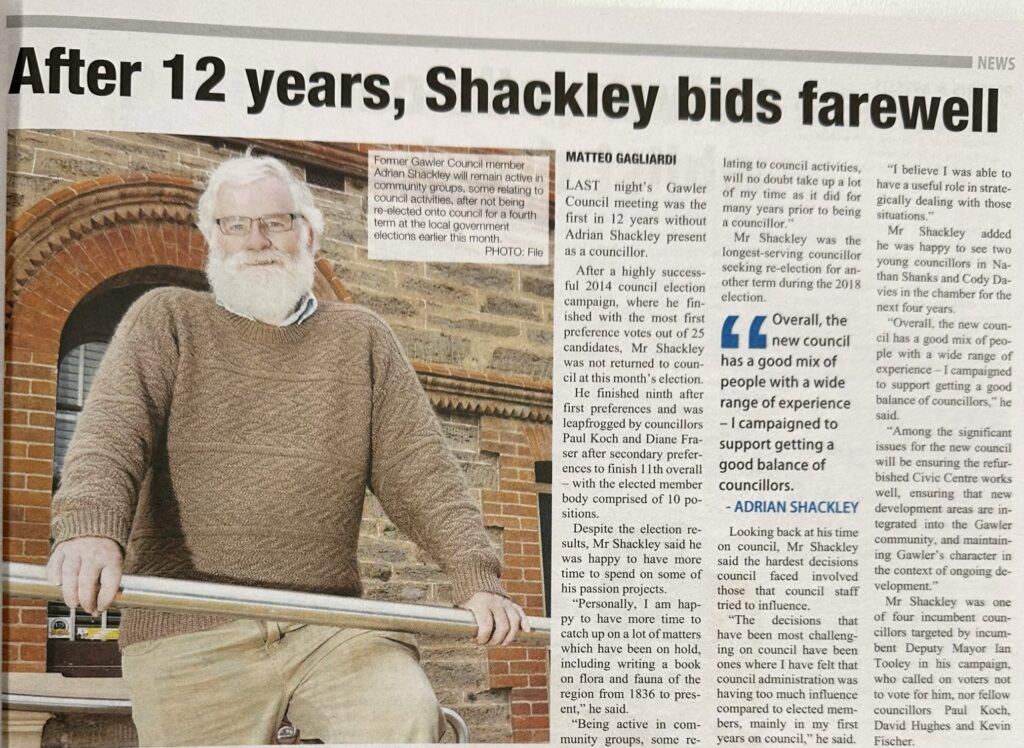
11. Adrian Shackley (incumbent)
12. Kevin Fischer (incumbent)
13. Beverly Gidman (incumbent)
14. Robin “Nobby” Symes (incumbent)
15. Shauna Gejas (new)
16. Alex Bradley (new)
You can see why the Bunyip would call it a “shake-up”; after all, only four of the previous term’s Councillors made it through, and there were six changes. From another perspective, though, the only two people being brought into the Council for the first time were me and Nathan Shanks, which we certainly felt while trying to navigate through the early days of the Council term.
The Problem with Gawler Councillor Ballots
There are a few interesting points to note about these results, and you can look through the full 70-page preference allocation document here if you like. To start with, though, I’d like to cover a meta-aspect of the whole process, prompted by the results above.
The top three spots on the 2018 ballot finished second, first and third respectively – to what degree is this coincidence and to what degree is a candidate helped by a top billing? In other words, how much does it matter in what order Councillors are placed on the ballot papers? I did some data analysis to find out.
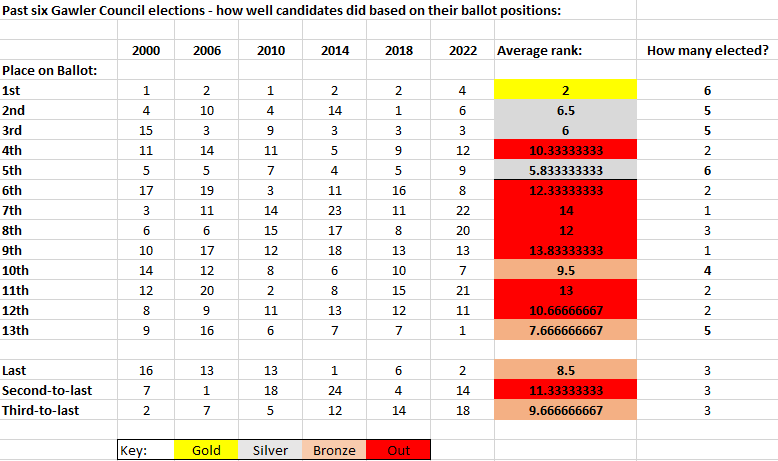
It’s not the neatest-looking Excel spreadsheet, but essentially what I did was map out where candidates were positioned on the ballot papers and compared that to how those candidates performed in the election, then also did so for all the previous Gawler Council elections I had data for (2000 is when we switched from wards to full-council elections so elections prior to that aren’t comparable).
Before we can make use of this graph, though, I do have some disclaimers:
- The actual popularity of the candidate clearly also matters, which can lead to some outlier results. For example, former two-term Mayor Brian Sambell has enough name recognition to power through to first place from any random location on the ballot papers, as he did in 2022.
- Some elections have more candidates than others (2018 had 16 candidates whereas 2022 had 23) so the ranking comparisons aren’t always exactly like-for-like.
- The data set isn’t huge, which means that a coincidence repeating a couple of times can have an impact on results, like the unlucky fourth place that seems to be out of step with its nearby results.
- The reason the 2003 election is missing from the data set is that in 2003, exactly ten people applied for ten Councillor positions and they all got automatically elected. Funny story; we’ll get to it in a later post.
All of those disclaimers aside, we do have some very interesting trends we can draw from this. To start with, first place on the ballot is quite simply a golden ticket. It’s not just that they are always elected, but that they finish, on average, in second place. The benefits from already being popular probably multiply the effect, but even when the candidate is a relative unknown or newcomer, this ballot spot legitimately seems to be worth at least a couple hundred extra votes. A few of those top-of-ballot candidates who secured unusually strong wins were running for Council for the first time.
This is a strong enough trend that I’m confident to make a statement on it even though the data set is limited. Not to say that nobody could ever lose from the top of the ballot, but it’s clearly a significant boost to your chances,
Also, being in the top five isn’t bad either. Fourth place is an outlier in the data here as it does seem to have had a string of unlucky runs where the candidate finished barely outside the top 10 – it’s had two 11th-place finishes and a 12th-place finish. Second place and third place on the ballot papers, though, have seen their candidates elected five times out of six elections (usually with quite good placings), with fifth place maintaining a perfect 6/6 election record so far.
Outside of those trends, though it’s hard to find something consistent that isn’t just noise. So, we know that approximately the top five ballot positions consistently outperform others, but why are people voting like this? There are a few theories.
- People typically read lists starting from the top, If someone has two or three people they’re interested in voting for, and they start reading and spot one of them first, it’s not unreasonable that they would put a 1 in the box. In that way, people at the top of a ballot win a high percentage of what would otherwise be toss-ups.
- Not everyone understands that ranking ten people doesn’t mean that you have been given ten votes of equal value that you are handing out. This is a misunderstanding that I’ve run into before. You only have one vote, and the point of the preference system is to make sure that vote is not wasted if your preferred candidate has already been eliminated or already been elected. Combine this factor with people reading lists from the top, and you get people voting for someone as their first preference who would otherwise be their sixth preference.
- Ten is a lot of people to rank. This is a side-effect of not having any wards – if we were only electing two or three representatives, some of these issues would still surface to a smaller extent, but it would be easier for the average resident to keep track of who’s running. But if you take the average person who hasn’t been paying attention to Council politics, and tell them to filter out 10 candidates from a pack of 25, it can be overwhelming. This can lead to:
- Donkey voting or partial donkey voting. Full-on donkey voting (meaning, ranking everyone in order from top to bottom) is less of an issue at the local level because Council elections are non-compulsory and apathetic citizens are more likely to simply not vote. But here’s a more realistic scenario – there are five people on the ballot that you know or care about, but when you’re done you still need to reach 10 in order for your vote to count. Simple solution – rank the candidates at the top of the ballot paper 6, 7, 8, 9, 10. A nice little unexpected shower of support for the ballot paper’s top five.
Something to keep in mind the next time you vote! All that said, let’s get on to investigating this 2018 election in particular.
Analysis of Councillor Preference Flows
One notable part of the result for this year is that the Councillor election had some fairly significant changes between the first preference count and the final result.
For example, Diane Fraser, who looked like she was going to finish well outside the ten available positions, suddenly rocketed six places from 13th to 7th, like an average Park Run participant who hit the final stretch and suddenly became an Olympic sprinter. What’s going on there? I’ve created a little chart to show where candidates have moved up or down during the vote distribution process.
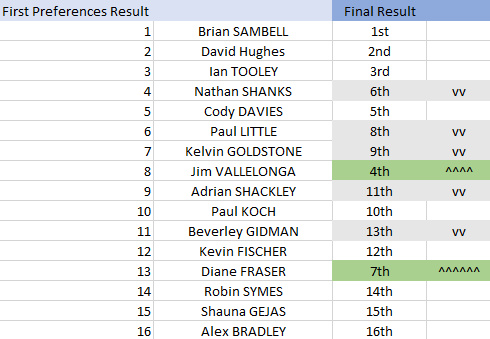
As you can see, there are two people who majorly benefited from the candidate elimination process. Let’s start with Diane Fraser, whose jump was the most notable. She generally did well whenever someone was eliminated – a sign of high name recognition and high all-around acceptance of her as a choice.
Where she really pulled away from the pack, though, was in the preference flows of the other female candidates. This makes logical sense if you look at the demographics of the election – there were only three women running, and two of them were knocked out early. Voters who consider that a priority would be likely to list all three women in their ten required preferences, leading to a snowball effect if two of the three were to be knocked out.
When Shauna Gejas was eliminated, her 143 first-preference votes were divided mostly evenly between the 12 remaining candidates, except that Diane Fraser single-handedly took 51 of those votes – more than a third. Altogether, between the full redistributions from just Shauna Gejas and the other woman on the ballot, Beverly Gidman, she gained around 125 votes (which if she’d had at the beginning would have put her in 6th place rather than 13th).
Then we come to Jim Vallelonga, whose sprint up the charts also revolves around Beverly Gidman’s elimination, funnily enough. Most of the other candidates had a fairly even spread of preferences when they were eliminated, but consistently over the past two elections, Gidman’s voter base of rural Kudla and Hillier residents has been remarkably disciplined in assigning preferences. In 2018, when Gidman was eliminated and her initial 212 votes redistributed, 51% of the vote went to Jim Vallelonga, another 20% to Diane Fraser (for reasons we’ve already covered), and then the remaining eight remaining candidates averaged about 3-4% each.
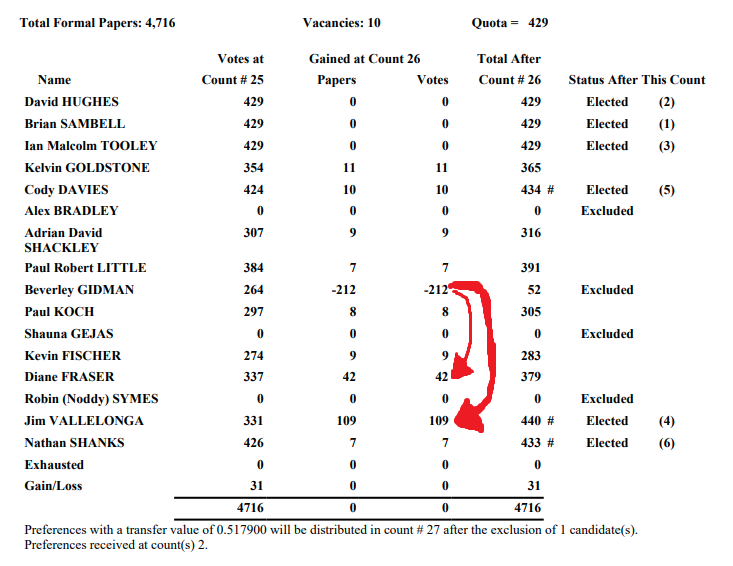
This is what a preference flow elimination process looks like (the poorly-drawn red arrows are mine).
Understanding this preference flow requires some knowledge of political issues in Gawler, namely the dispute over the land classification of its southern rural areas. What Beverly Gidman represents is an organised group of Kudla landowners who want to be allowed to further subdivide their properties but currently aren’t able to due to minimum property size requirements.
This was a fiercely fought debate in the prior 2014-2018 Council term, with clearly formed sides – Cr Gidman could rely on Cr Vallelonga and others like Cr Ian Tooley (who does not feature in this redistribution as he had already reached quota) to vote in favour of her preferred position. Then, when it came time for the 2018 election, they formed a candidate bloc that would list each other as high-priority preferences on their election fliers and other promotional material.
While Beverly Gidman’s voters may have been disciplined in their preferencing, they only had enough numbers to help prop up a candidate, not ensure that one reaches the quota, so ultimately their vote ended up a little wasted in this particular instance; it merely propelled Jim Vallelonga from 8th to 4th rather than ensuring that another friendly face could make it past the ten Councillor cutoff.
A similar situation would play out, again to Jim Vallelonga’s benefit, in the 2022 election, when the elimination of rural areas candidate Karen Brunt led to 60% of her first preference vote going straight to Vallelonga (in a field of 10 remaining candidates). In this case, it shot him up from 11th to 10th and really did secure a win for him, though not an extra vote, as the victim of this redistribution was Shane Bailey, who had similar views regarding the rural areas.
Incidentally, that result didn’t remotely line up with Karen Brunt’s own preference list as printed on her fliers, which goes to show that while she was their favourite choice, the Kudla land owners group were still operating independently on their own preferences, rather than Brunt’s.
Well, I’ll leave my post there for now. Look forward to a three-way Mayoral race next time as we get into the 2014 Gawler Council election.
Gallery
Thank you for this Cody. Its very informative and interesting. I actually didnt know a lot about the process when I nominated.
I will however say this that the press didnt give each candidate equal exposure. Some people got half page stories with headlines and photos. And some got no support at all except for the general info with everyone on the same page. Its a shame more residents dont vote .And i still dont understand the preferencing system. Keep up the good work.
Pingback: 2014 in Gawler's Election History - Cody Davies - Town of Gawler Elected Member
Pingback: 1991 in Gawler's Election History - Cody Davies - Town of Gawler Elected Member
Pingback: 1989 in Gawler's Election History - Cody Davies - Town of Gawler Elected Member