Recently, I have been cataloguing past election results for the Town of Gawler, as a mixture of personal hobby and historical record. While some of the more recent elections are still easily accessible for now, anything prior to around 2006 is very hard to find, which I think is a shame as it’s of historical relevance to our community.
I plan to start with the most recent elections and move on from there as part of a new blog series, which you can find all together here. To kick it all off, here are the November 2022 Gawler Council Elections, which had a large number of candidates and a relatively high voter turnout (compared to the usual) of 34.43%. I’ll also include some commentary when I have something interesting to share.
The Mayoral Election
There were four candidates for Mayor this year. In the order they appeared on the ballot, they are:
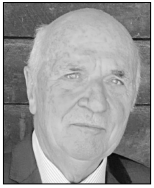
Paul Little – An incumbent Councillor who has had four (non-consecutive) Council terms over the years. Has a long history with the local RSL and football league.
Candidate profile quote: “I believe I have the ability to bring all people together to enable the Town of Gawler to progress in the manner it should. I believe consultation will be my key role if elected”.

Ian Tooley – A two-term Councillor from 2014-2021, who resigned from Council a year before the 2022 elections. Spent three years as Deputy Mayor during his time on Council.
Candidate profile quote: “On Council I have a proven track record of listening and acting; of openness, accessibility and responsiveness; of opposing waste and bad policy”.

Karen Redman – The incumbent Mayor for eight years from 2014-2022, prior to which she was a Councillor from 2010-2014. Gawler Council’s first popularly-elected female Mayor.
Candidate profile quote: “Putting community first, with an energetic and modern approach, Karen will lead Gawler to a strong future”.
John Bolton – A local lawyer with no history on Council, but with a couple of second-place finishes in previous Gawler mayoral races in 2010 and 2014.
I haven’t included a photo here due to his deliberative decision not to provide one in the election booklet. In the words of his candidate profile, “I provide no photo. You either know me or you don’t. You either agree with my value’s or you don’t.”
You can view the full Mayoral candidate profiles here. The final results of the election were:
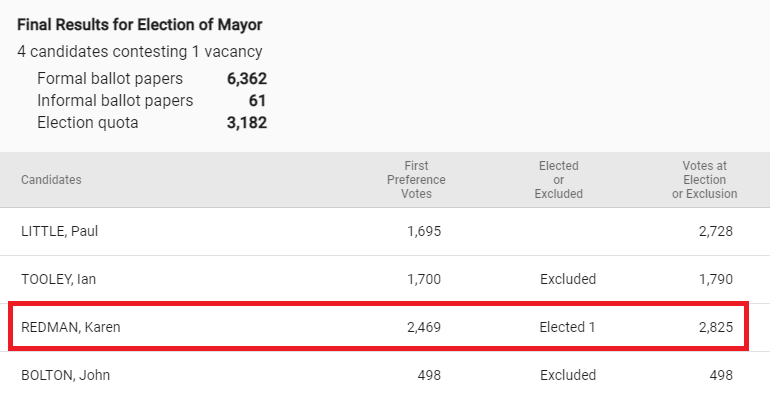
Karen Redman was re-elected by 97 votes, ushering in a third term as Mayor that will last four years, from November 2022 to November 2026.
Analysis of the mayoral result
To get a fuller picture of what happened, let’s dig into this result a little more. If you don’t spend all day looking at election results, you may be slightly confused by the above chart.
The election quota is clearly listed as 3,182, but the Mayor was re-elected with only 2,825 votes. In other words, while a winner needs a majority (50.1% of the vote), the Mayor won with only 44% of the vote, beating Paul Little who finished with 43% of the vote.
What happened here? 44 + 43 only adds up to 87, and all the other candidates have been eliminated by the time we reach the final result, so where has the remaining 13% of the vote vanished to? The answer is that this is the result of the current rules we use for these elections – what you would call an optional preferential election system, meaning that voters can either simply select their first preference, or choose to continue on and list their further preferences in order.
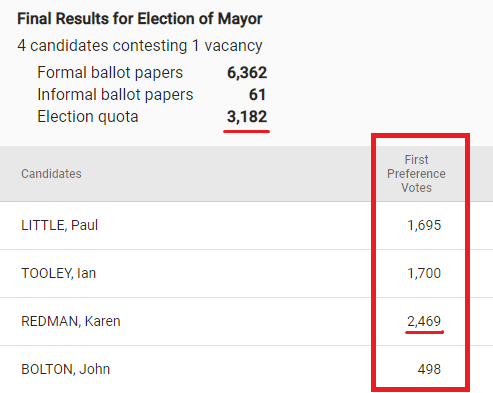
At the beginning of the process, first-preference votes are counted and everyone starts with the number of votes listed in the “First Preference Votes” column above. Karen Redman is in the lead with 2469 votes (39% of the vote), but the race isn’t over yet – after all, the three other candidates still hold 61% of the vote between them, and the elimination of unviable candidates (and re-distribution of their preferences) is about to begin,
At this early stage, Karen Redman is 774 votes ahead of Paul Little, and yet by the end, we know that her lead was reduced to only 97. Why is it that she was so strong in first preferences, but then struggled with later ones? Think about it this way: the Mayor’s name recognition was high and she was, to speak the obvious, already the Mayor, so people who are happy with her as Mayor are likely to simply vote for her directly. Her voter base is already well-represented by the first preference count. What has been split into three is the “anti-Mayor” vote – people looking for a change, but not sure who to pick.
A small percentage of voters for those candidates will preference the Mayor second, but by the end, she will have only gained 5% of the total vote through the preference process, whereas Paul Little will have gained 16%; he’s winning these preference re-distributions at better than a 3:1 ratio. Unfortunately for him, this re-distribution process is also very inefficient and constantly bleeds votes, meaning that another 13% of the total vote is lost entirely during the process. That’s a huge number, considering that he was only 1% of the vote away from victory at the final step.
So, what is happening with these lost votes? Let’s get into the actual details of the eliminations now to explain them. You can also look at the official working-out here, but I’ll explain it in a much less messy-looking way.
Firstly, John Bolton, who received the least votes, is eliminated and has his 498 votes redistributed.
His vote redistribution goes like this:
- 123 people who voted “1” for John Bolton followed up by listing a “2” for Paul Little.
- 90 people gave their second preference to Ian Tooley.
- 75 people gave their second preference to Karen Redman.
- A whopping 210 people gave their second preference to nobody at all, and their votes no longer matter in this election.
There are multiple reasons why someone may choose not to continue their numbering after “1”. It may be due to simple ignorance that this choice matters or that this choice is available to them at all. Alternatively, they may have an all-or-nothing approach – they want John Bolton, and if they can’t have him, then they no longer care who the Mayor is.
Either way, given that only 15% of his voters gave Karen Redman their second preference, the end result of Bolton’s election run is probably that the Mayor benefited slightly from it. After all, if he hadn’t run, and some of those 210 no-preferencers had been forced to choose between the other candidates, it seems like the main beneficiary would have been Paul Little.
That said, it’s not entirely that simple. There is a valid counter-argument that this is an optional election and so Bolton’s voters may have simply never voted if nobody else appealed to them. However, it doesn’t require much to tip such a close election, so even if those who wouldn’t have voted are a majority, the remainder could have swung the outcome.
After John Bolton is dealt with, the next to be eliminated is Ian Tooley – he was ahead of Paul Little by five votes on first preferences but has fallen behind now that Bolton’s preferences have been distributed. Surviving a preferential election is kind of like surviving a bear attack – what’s important isn’t how fast you can run, but whether you can run faster than your friends. Paul Little’s final little burst of votes during the Bolton re-distribution has landed him “bearly” ahead of Ian Tooley, who has now been eaten by the Election Bear.
As the Election Bear digests Tooley’s 1790 votes (90 of which are originally from Bolton) it produces:
- 910 more votes for Paul Little.
- 281 more votes for Karen Redman.
- 599 more votes for nobody at all.
With only two candidates remaining, this produces the final result:
Karen Redman: 2825 (elected)
Paul Little: 2728 (runner-up, though there is no prize for this)
Bolton and Tooley voters who didn’t specify who they would prefer between the two final options: 809
As you can see, Karen Redman comes out of this with the most votes, so her win is valid even though she dropped below the original 50.1% quota threshold.
So, what are the strategic takeaways from this? If I had to name one, it would be that “spoiler candidates”, which aren’t usually a problem in Australia, can still exist in this optional preference system. For comparison, in an election for a lower house Member of Parliament (whether state or federal), no votes are lost during the vote re-distribution process.
A Greens candidate taking 10% of the vote does not hurt the Labor candidate, because that Greens candidate can be assured that anyone who would have voted for Labor in the absence of a Greens candidate will still list Labor in their preferences. That’s not the case here.
The Councillor Election
Well, I may have accidentally sidetracked myself with an entire thousand-word essay, but I should get to the other election now: that of the ten Councillor positions.
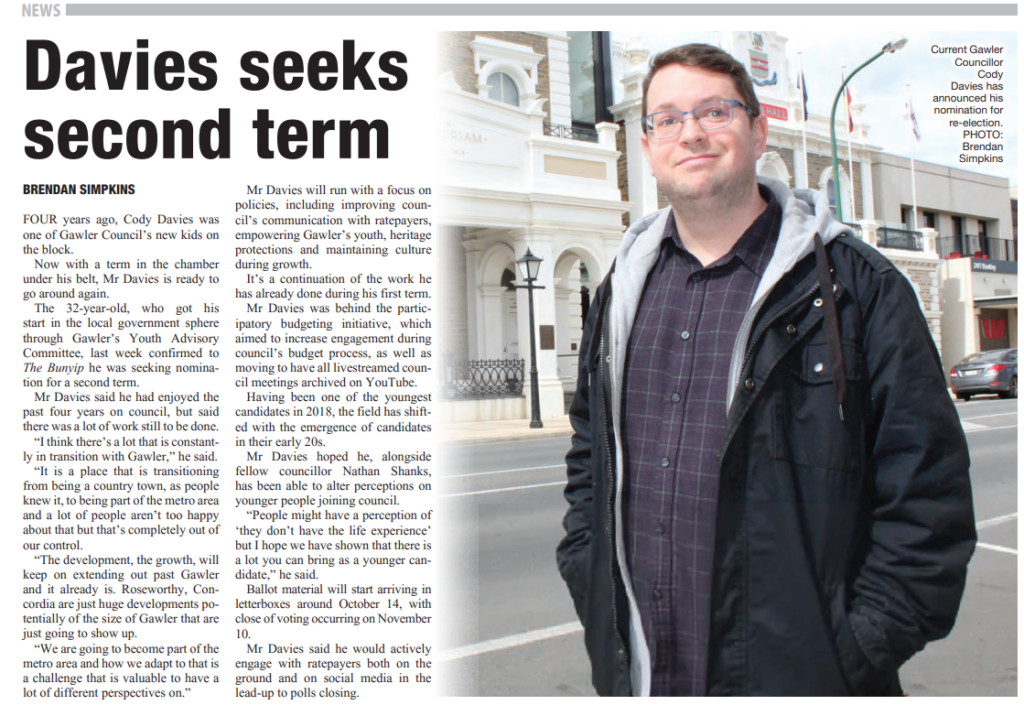
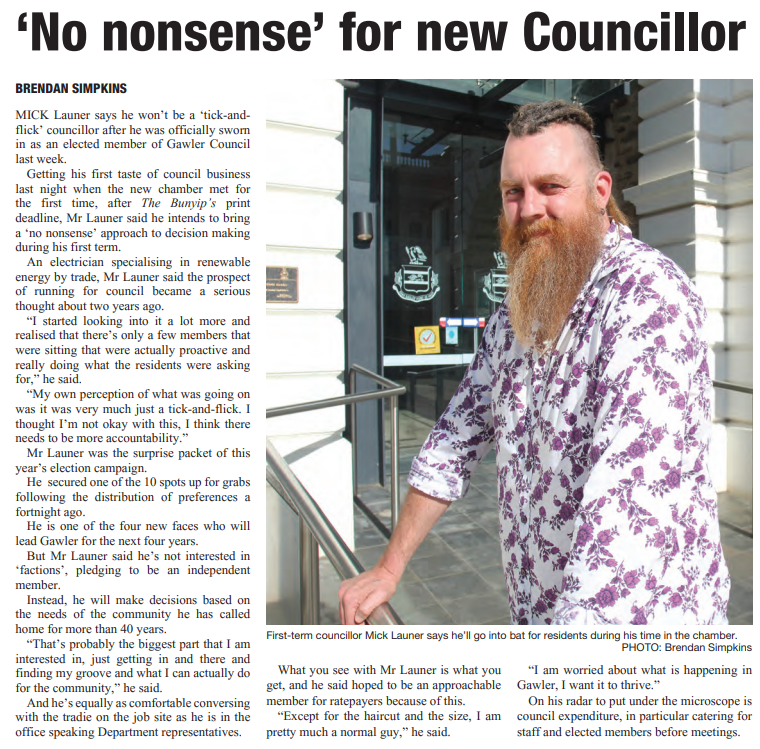
Who’s that cool-looking Councillor candidate?
I won’t be explaining this election process at the same level of detail because that would require not just a thousand-word essay, but a full PhD thesis and hopefully a team of assistants. Simply the list of all the redistributions they had to do to get this result is a 304-page document (which you can take a look at here if you like). But, I will cover the basics of what makes this different from a mayoral election.
- There are 10 vacancies instead of 1. The quota for Mayor is half of the vote (plus one) because we are electing one Mayor. Since this is instead electing ten Councillors (we don’t have any wards so it’s just everyone all at once) it’s an eleventh of the vote (plus one). In this case, there are 6052 formal ballots, so once you reach 551 votes you’re elected.
- There were 23 candidates for the 10 positions this time around, which is honestly quite chaotic.
- This was also a case of optional preferential voting but only to an extent – a valid vote had to include 1-10 in order, but it’s your choice beyond that.
A full PDF of all the candidate profiles is available here. Anyway, here are the full results, with the winners highlighted in red:
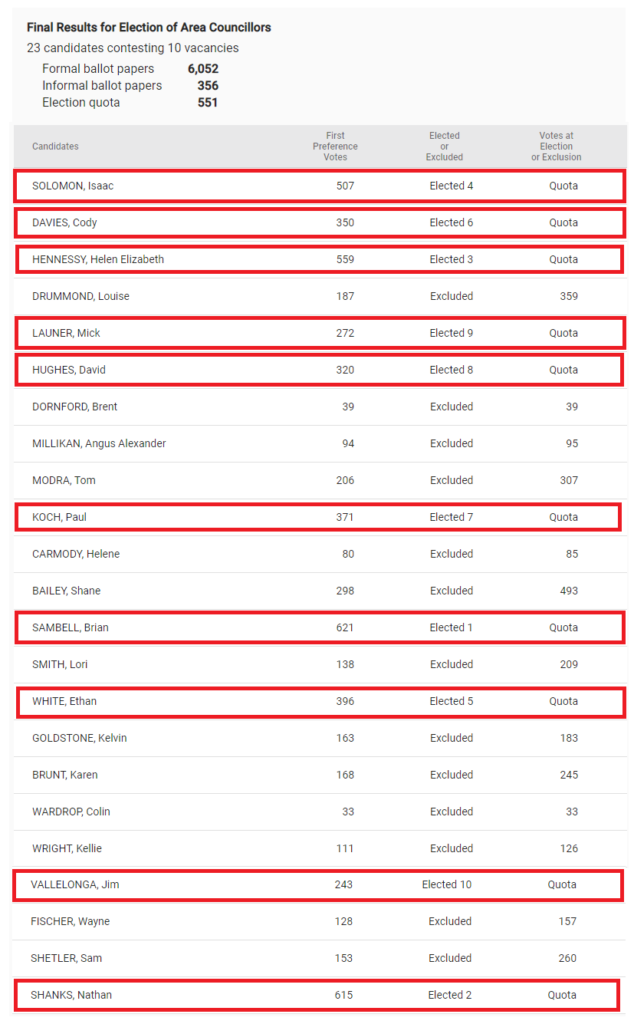
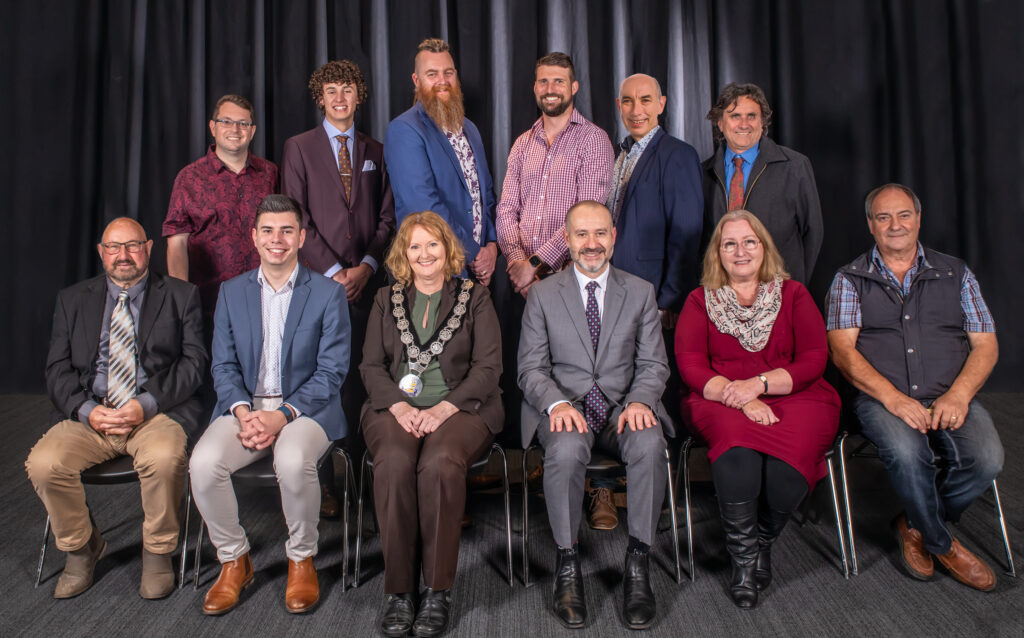
In order of their election, the Councillors for the 2022-2026 term are:
- Brian Sambell (incumbent Councilor and former Mayor)
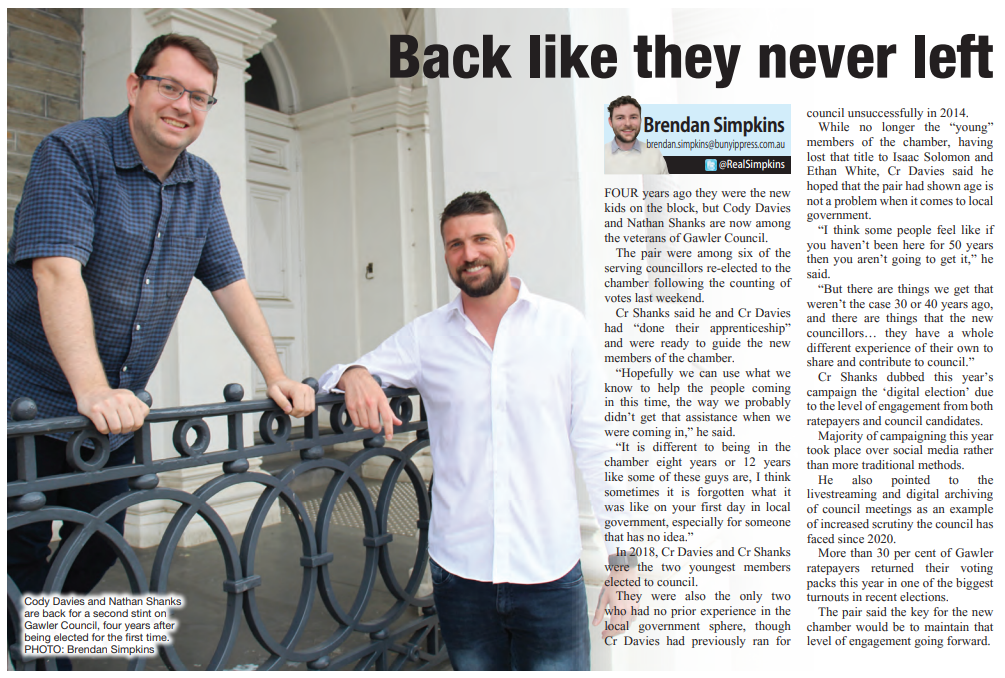
- Nathan Shanks (incumbent)
- Helen Hennessy (new)
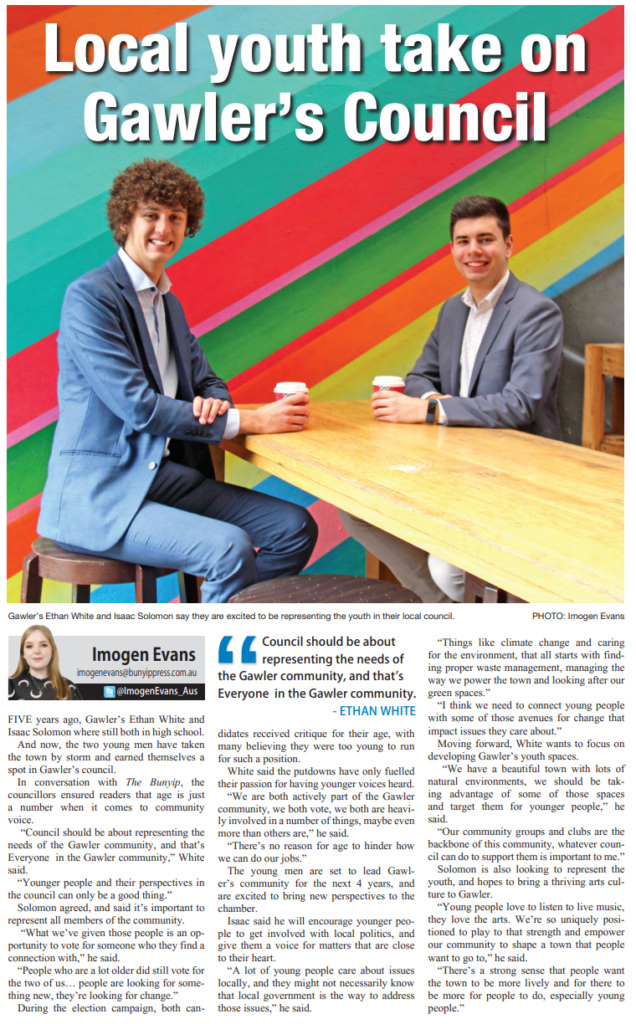
- Isaac Solomon (new)
- Ethan White (new)
- Cody Davies (incumbent) (that’s me)
- Paul Koch (incumbent)
- David Hughes (incumbent)
- Mick Launer (new)
- Jim Vallelonga (incumbent)
This mostly aligns with how the top ten list looked in the first preference count before redistribution started, aside from Jim Vallalonga who jumped one spot from 11th to 10th during that process, knocking Shane Bailey out of the position.
The four new Councillors are replacements for outgoing Councillors Kelvin Goldstone, who ran but didn’t get elected, Diane Fraser, who retired, and Ian Tooley and Paul Little, who both ran for Mayor and thus were unable to also run for Council (it’s a choice of one or the other).
Gallery
Great work. Thankyou for explaining the process.
Ive made no secret that I voted for a new mayor and change.
Someone who had the best interests of the ratepayers.
Pingback: 2018 in Gawler's Election History - Cody Davies - Town of Gawler Elected Member
Pingback: 2014 in Gawler's Election History - Cody Davies - Town of Gawler Elected Member
Pingback: 1991 in Gawler's Election History - Cody Davies - Town of Gawler Elected Member
Pingback: 1989 in Gawler's Election History - Cody Davies - Town of Gawler Elected Member
Pingback: 1987 in Gawler's Election History - Cody Davies - Town of Gawler Elected Member
Pingback: 1985 in Gawler's Election History - Cody Davies - Town of Gawler Elected Member